Loyola’s Sellinger School of Business opens data analytics visualization lab
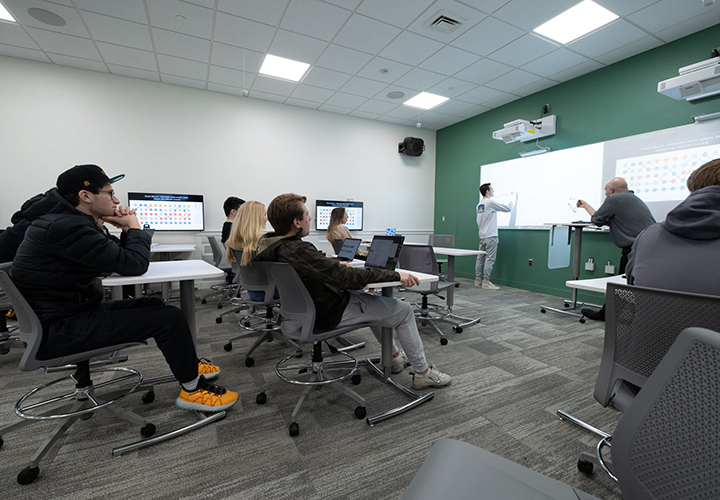
Loyola University Maryland’s Sellinger School of Business recently opened a new data analytics visualization lab, a state-of-the-art classroom outfitted with technology to help students interpret, manipulate, and present large amounts of data.
Students from a range of academic majors, including accounting and information systems, will learn skills crucial to the future of business.
“The lab will help turn students into storytellers,” said JP Krahel, Ph.D., CPA, associate professor and chair of accounting. “It’s not enough anymore to compile data. You need to be able to draw meaningful conclusions and to convey that meaning to stakeholders. This investment shows that we’re serious about future-proofing our students’ careers.”
The data analytics visualization lab will offer more powerful computing, projectors with touch capability on a 12-foot smartboard, seven large display monitors for huddle areas, integrated Zoom video conferencing with a high-resolution camera that can track subjects, and movable, modular classroom furniture. The technology will help students turn raw data into colorful charts, graphs, maps, dashboards, and other graphics to aid in data-driven decision-making.
“Labs like this include state-of-the-art systems that help students visualize massive amounts of data. This is a dream space for both students and faculty,” said Paul Tallon, Ph.D., professor and chair of information systems, law, and operations management. “We are already reimagining courses to take advantage of everything this room has to offer. Students can learn and collaborate in radically new ways that will build skills for a data-centric world.”
Data visualization technology skills can help accounting graduates, for example, with interpreting and reporting financial data, a growing need in the accounting industry. Other industries also need graduates with data visualization skills, which—in another example—can help decision-makers understand real-time supply chains, overcome bottlenecks, and streamline operations.